GBP/CAD Price Analysis: A fade on rallies from weekly resistance
- GBP/CAD bears are looking for a fade on rallies.
- The weekly resistance s compelling and could give rise to a downside extension in the coming days.
GBP/CAD has been a strong performer at the start of the week as the pound parse back some of the Bank of England sell-off from last week. The cross has rallied around 0.5% on the day which has given rise to a bearish prospect on the charts for the week ahead, as illustrated as follows:
GBP/CAD weekly chart
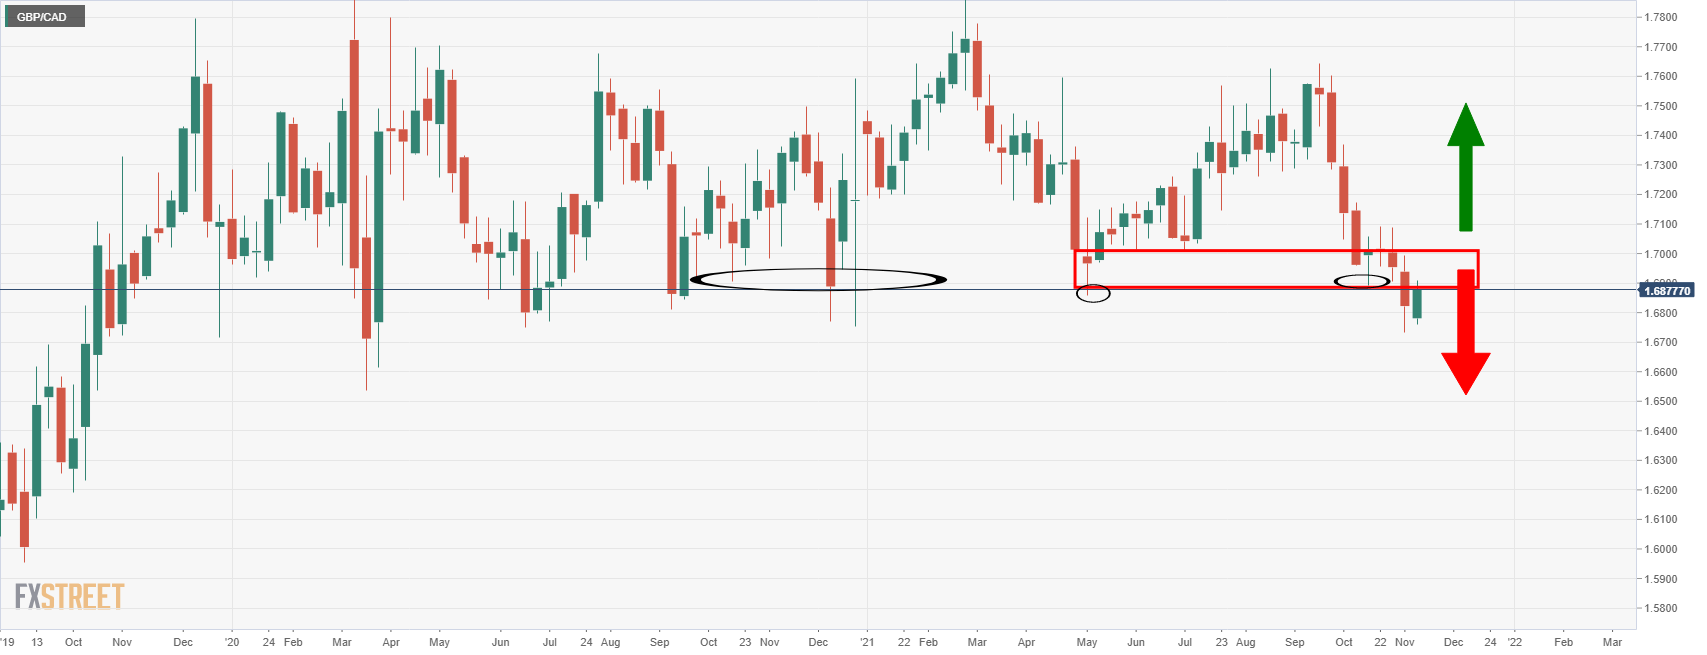
The weekly chart shows that the price is testing what is expected to be a solid area of weekly resistance. A break above, however, opens risk of a restest to the upside for the weeks ahead and further wide consolidation.
GBP/CAD daily chart
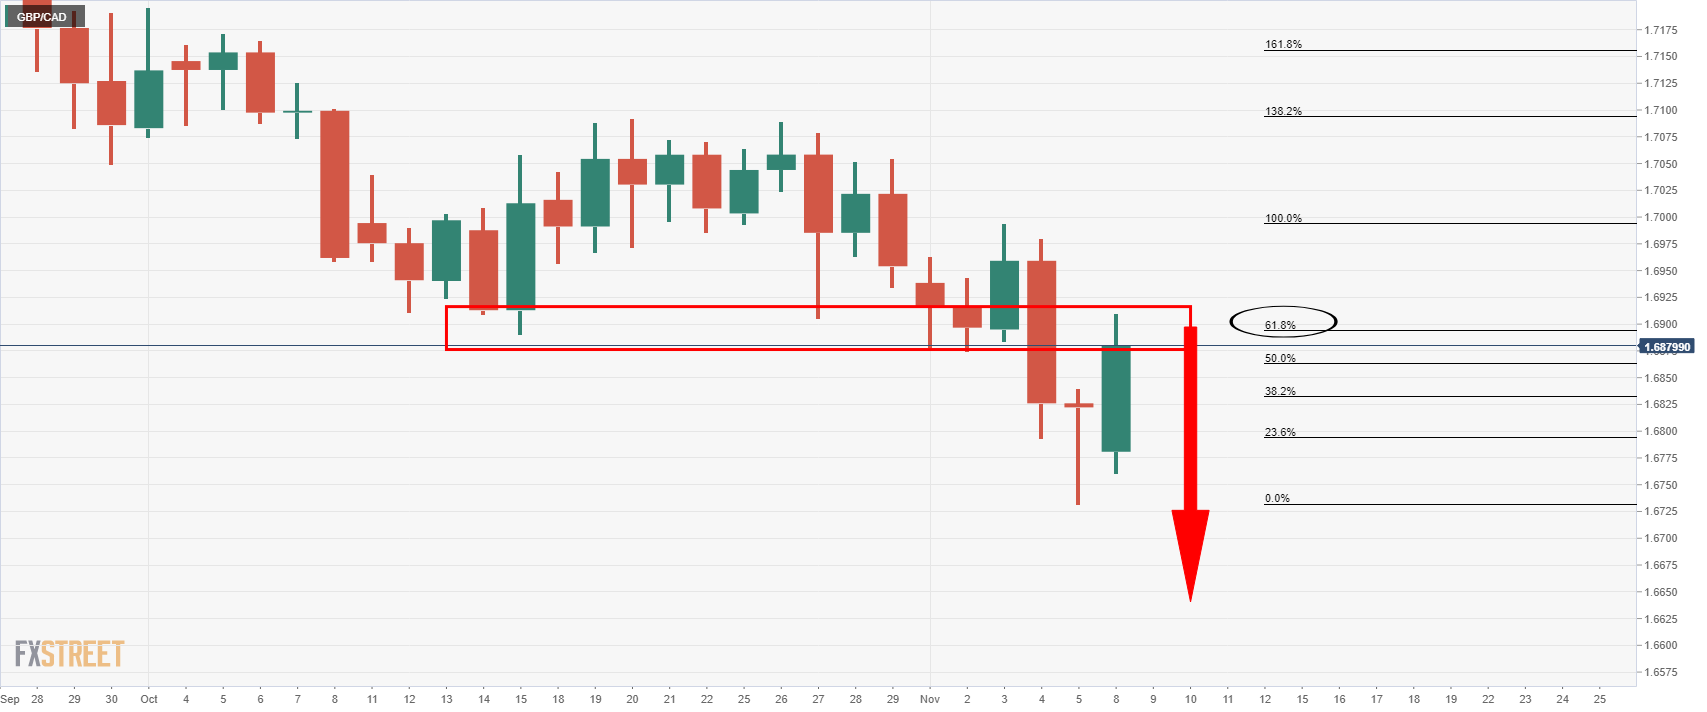
The daily chart shows that the price has rallied into this critical area of resistance also which would be expected to hold up on initial tests. The 61.8% Fibonacci is a milestone in this regard. Consolidation would be expected at this juncture and should the overall downtrend play out, then we can expect a downside extension to develop over the course of the comings days.
GBP/CAD 4-hour chart
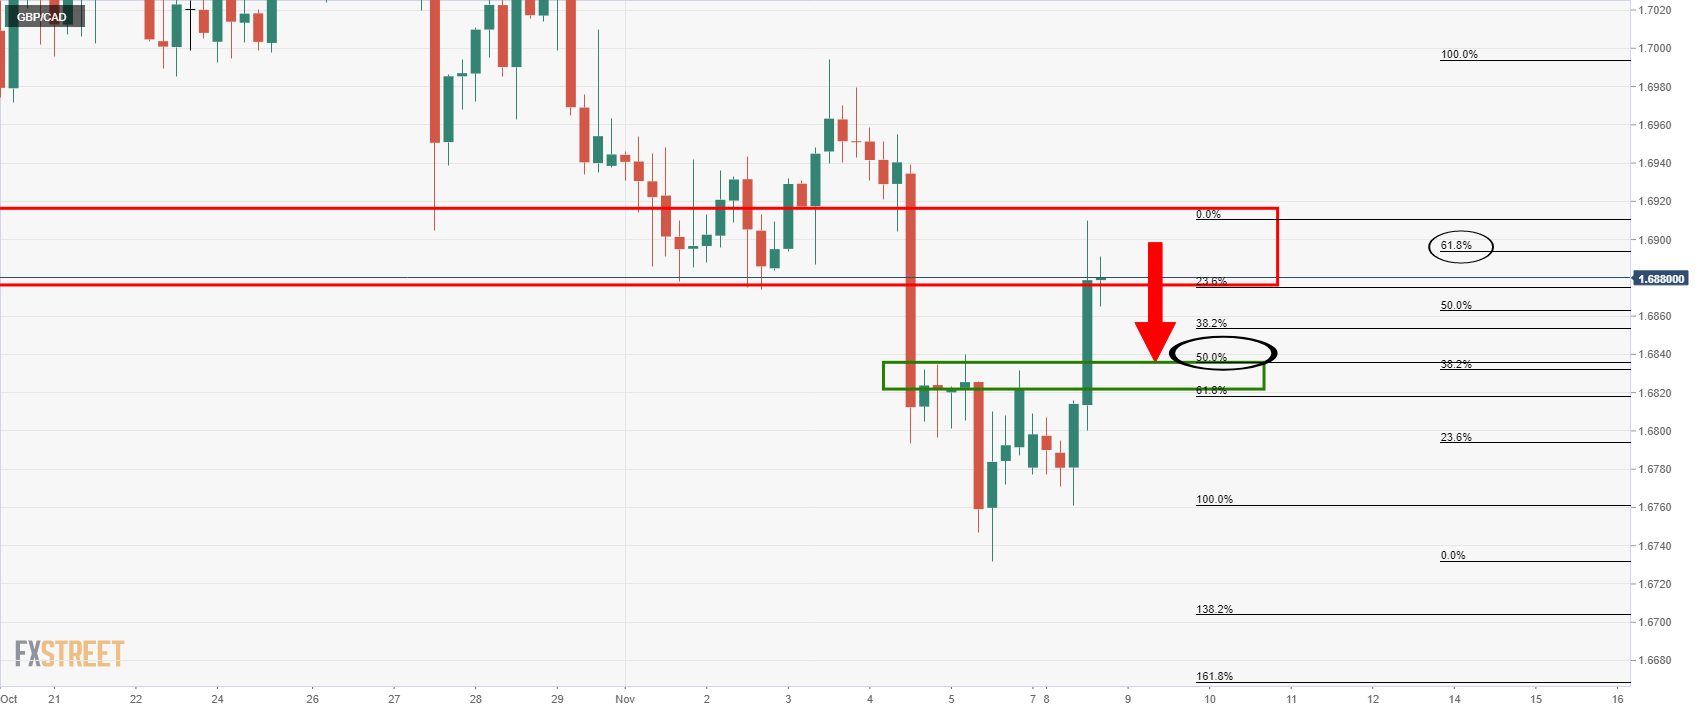
In the meantime, the 4-hour time frame sees the 50% mean reversion aligned nicely with the prior highs as a target for the bears. This comes near 1.6820.
GBP/CAD hourly chart
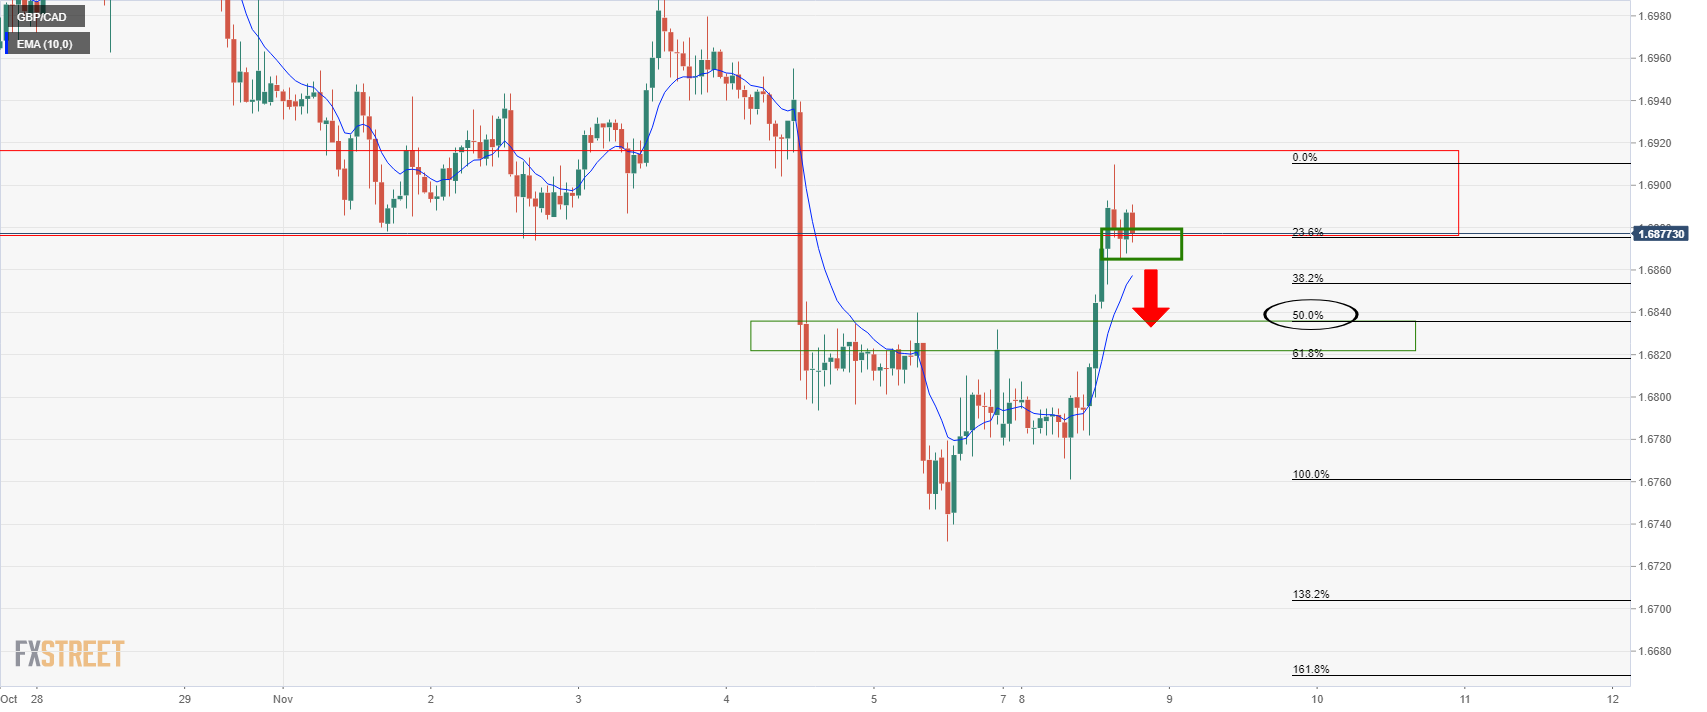
From an hourly perspective, there is some basing taking place near 1.6860, so bears will want to see this level of support cleared to open the way towards the 1.6820s in the forthcoming sessions.