USD/INR technical analysis: 2-week old support-line, 10-DMA cap immediate declines
- USD/INR stays firm above near-term key supports.
- 71.91/94 limits the upside attempts amid overbought RSI.
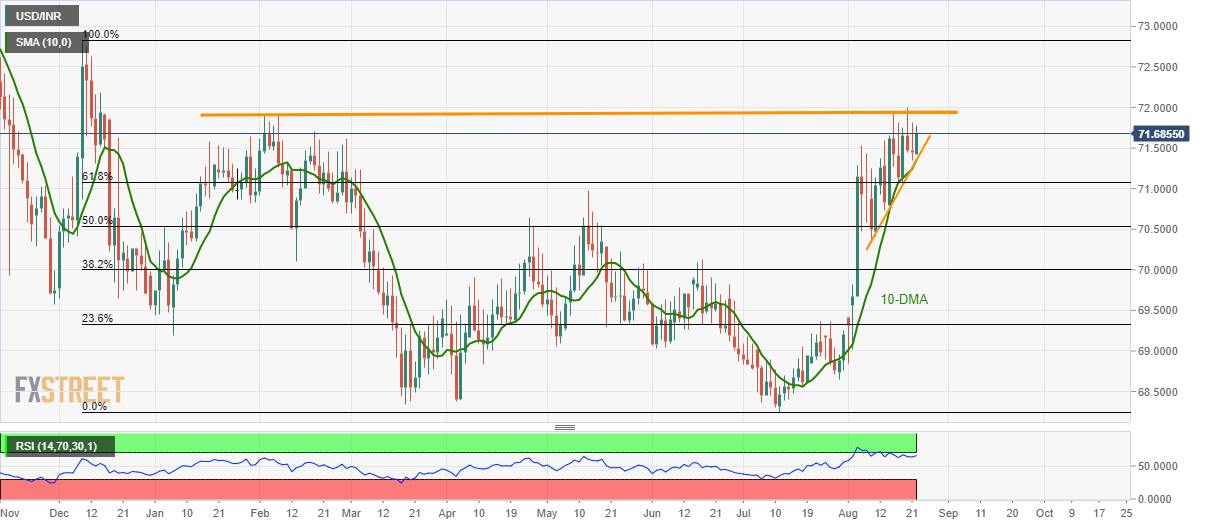
Having bounced off short-term support confluence, USD/INR takes the bids to 71.6685 before Thursday’s European session.
While a two-week-old support-line and 10-day simple moving average (DMA) limits the pair’s immediate declines, an area comprising early-year highs around 71.91/94 restricts the upside amid overbought conditions of 14-day relative strength index (RSI).
In a case prices rally beyond 71.94, bulls may wait for a sustained break beyond the current month high of 72.0051 to target December 2018 top at 72.82.
On the downside break of 71.35/36 support-confluence, the pair can drop to 71.08 comprising 61.8% Fibonacci retracement of December 2018 to July 2019 south-run.
Should there be further declines below 71.08, May month top surrounding 71.98 and 50% Fibonacci retracement level of 70.54 can come back on the chart.
USD/INR daily chart
Trend: Pullback expected