Back
11 Jul 2019
US Dollar Index technical analysis: Greenback attempts a come back above the 97.00 handle
- DXY regained some ground above the 97.00 handle.
- The 97.30 level can be a tough resistance to break for bulls.
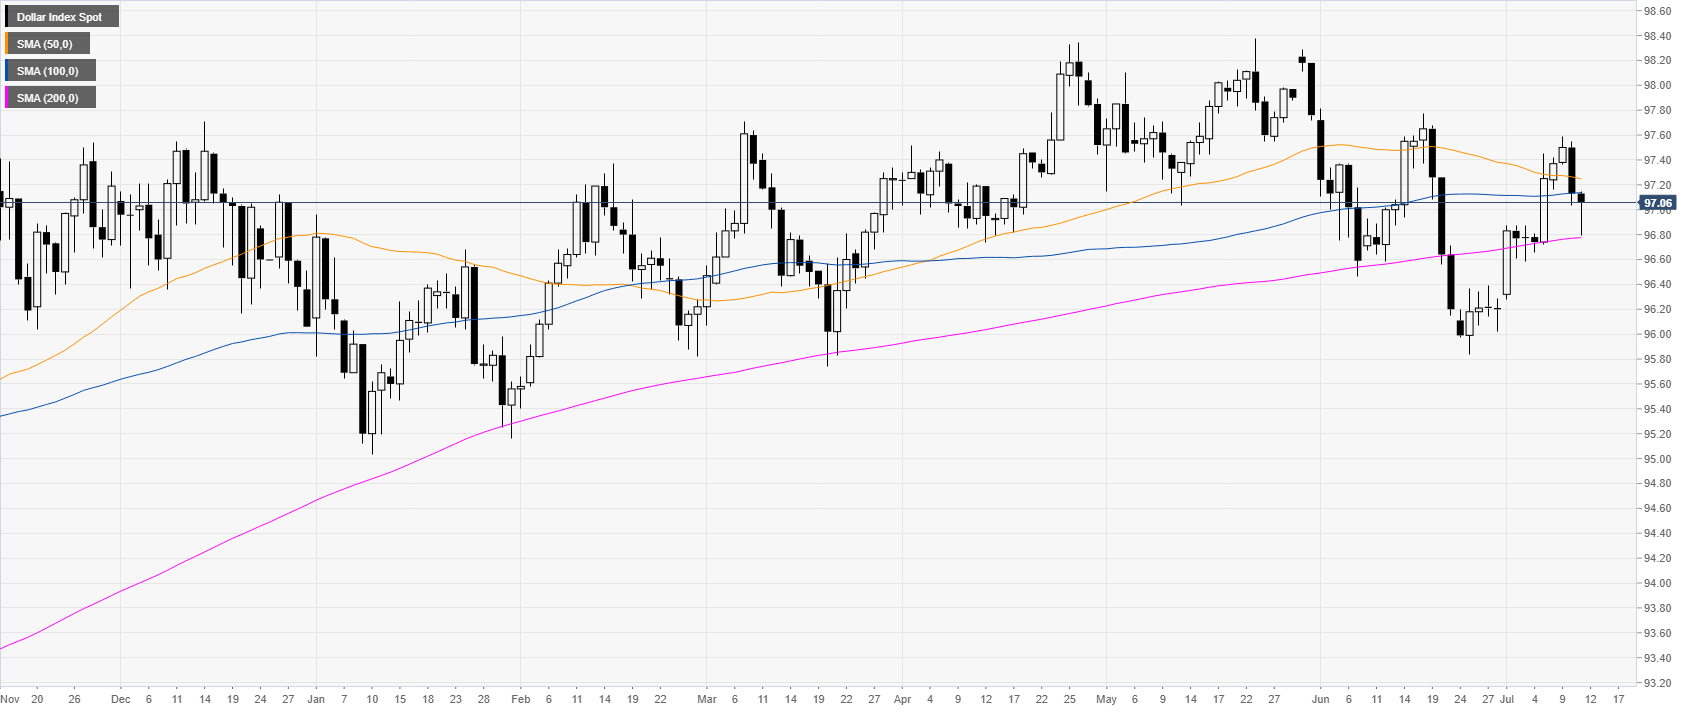
DXY daily chart
The US Dollar Index (DXY) tested the 96.80 level and the 200-day simple moving average (DSMA).

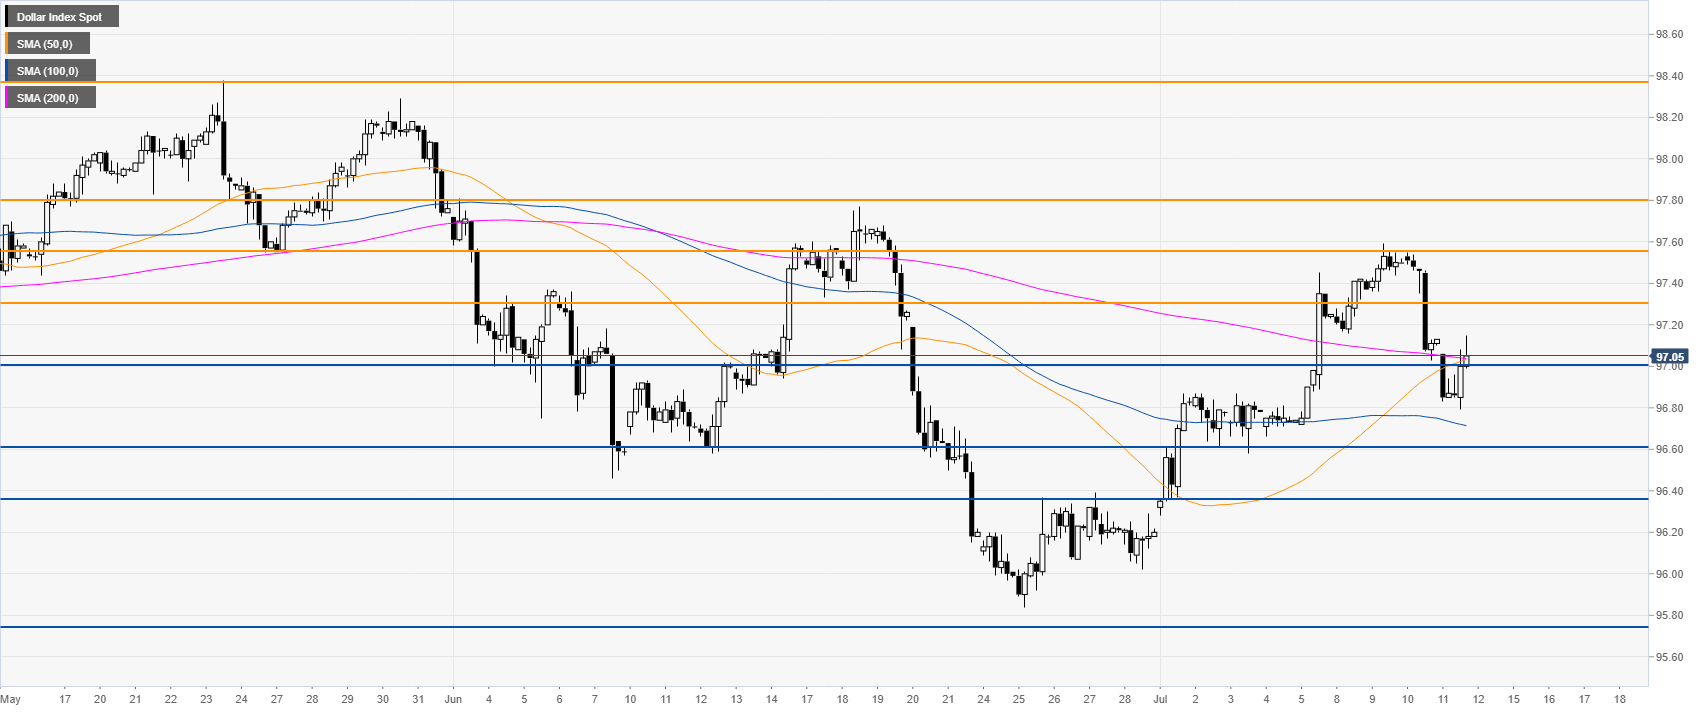
DXY 4-hour chart
The market is challenging the 97.00 handle and the 100/200 SMA. A breach below 97.00 could lead to 96.60 and 96.37.

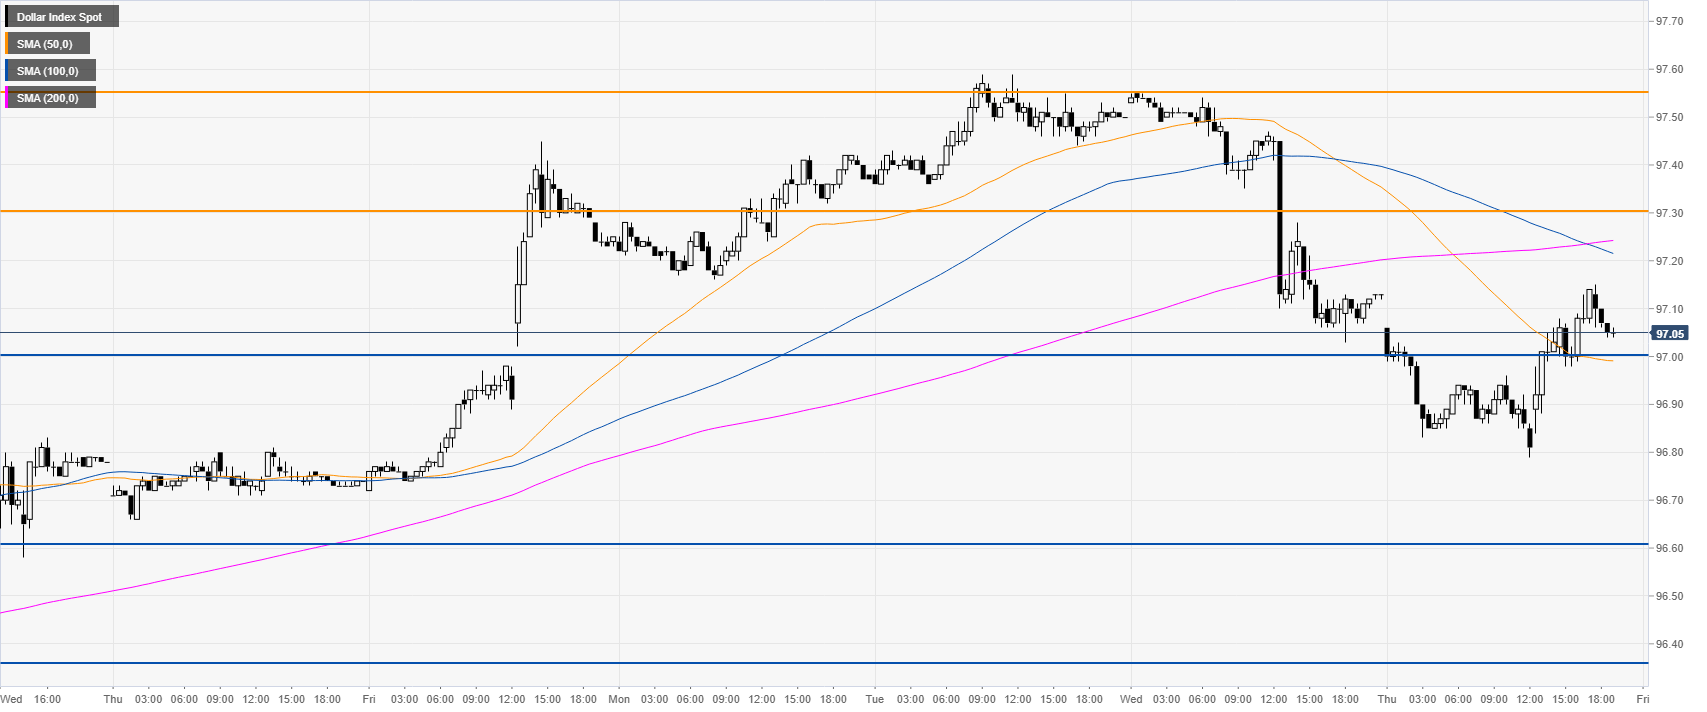
DXY 30-minute chart
The greenback snapped back up above 97.00 this Thursday. Bulls will try to reach 97.30 and 97.55 levels to the upside. The 100 SMA crossed below the 200 SMA (near 97.30) which is seen as bearish. The 97.30 resistance can become a tough nut to crack for bulls.

Additional key levels
