USD/JPY technical analysis: Bearish bias holds unless clearing 110.55/60 confluence
- Latest recovery seems tepid bounce from short-term support.
- Buyers may get a boost if crossing 110.60.
Although 38.2% Fibonacci retracement triggered USD/JPY pullback to 109.55 during early Friday, pair’s weakness can’t be ignored unless clearing near-term important resistance confluence.
As a result, the break of 109.45 can exert fresh selling pressure towards current month low near 109.00 whereas 50% Fibonacci retracement of January to April upside, at 108.60, may flash on seller’s screen then after.
If at all bears dominate prices sentiment past-108.60, 108.00, 107.75 and 107.45 could become their favorites.
Alternatively, 110.00 round-figure may lure buyers in the process of latest U-turn ahead of pushing them to 110.55/60 resistance-confluence comprising 23.6% Fibonacci retracement and 100-day simple moving average (SMA).
It should be noted that an upside beyond 110.60 could validate the pair’s rise to 111.00 and 111.80.
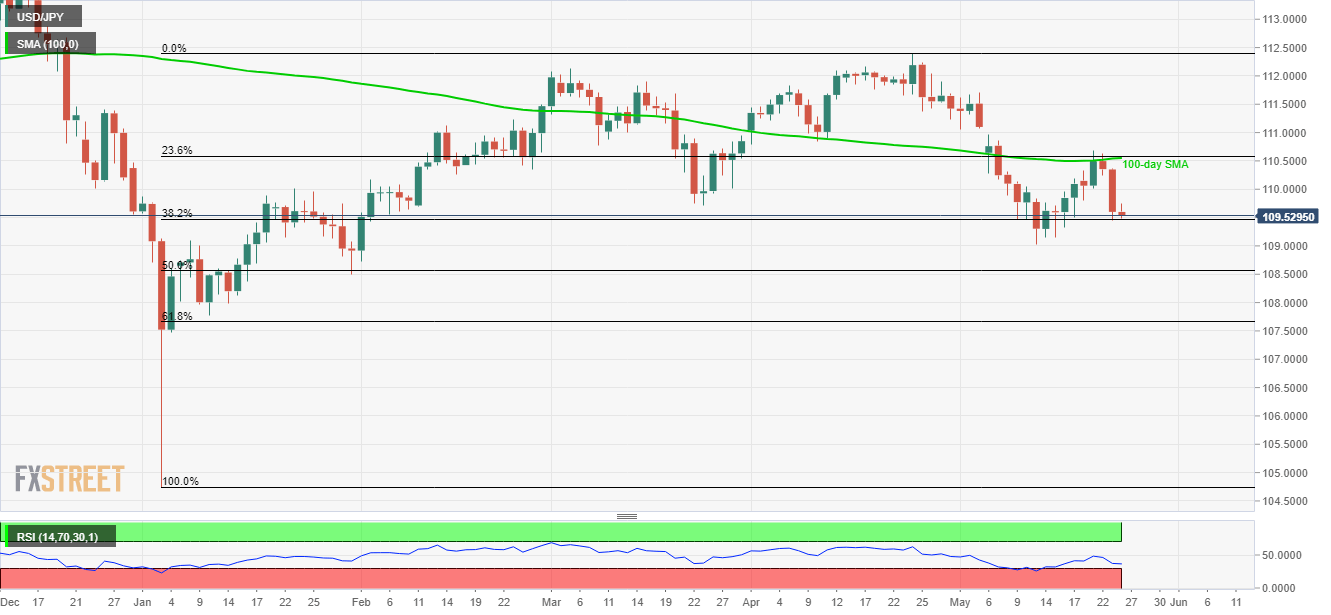
USD/JPY daily chart
Trend: Bearish