GBP/USD Technical Analysis: Cable blasting to 1.3050 level on Brexit hopes.
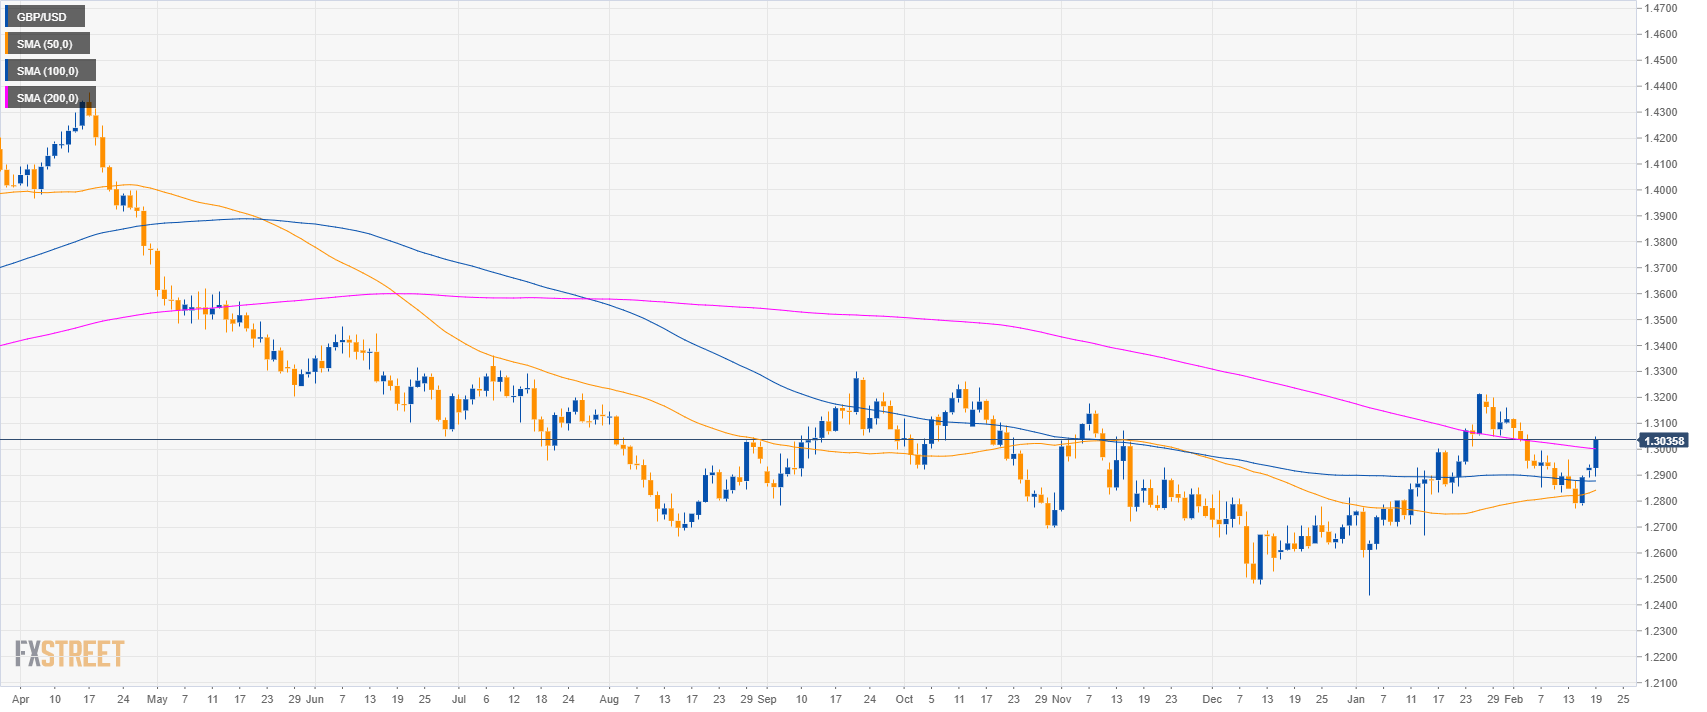
GBP/USD daily chart
- GBP/USD bulls are trying to reclaim the 200-day simple moving average (SMA).
- GBP got a boost across the board as PM May is still looking to reopen the withdrawal agreement.
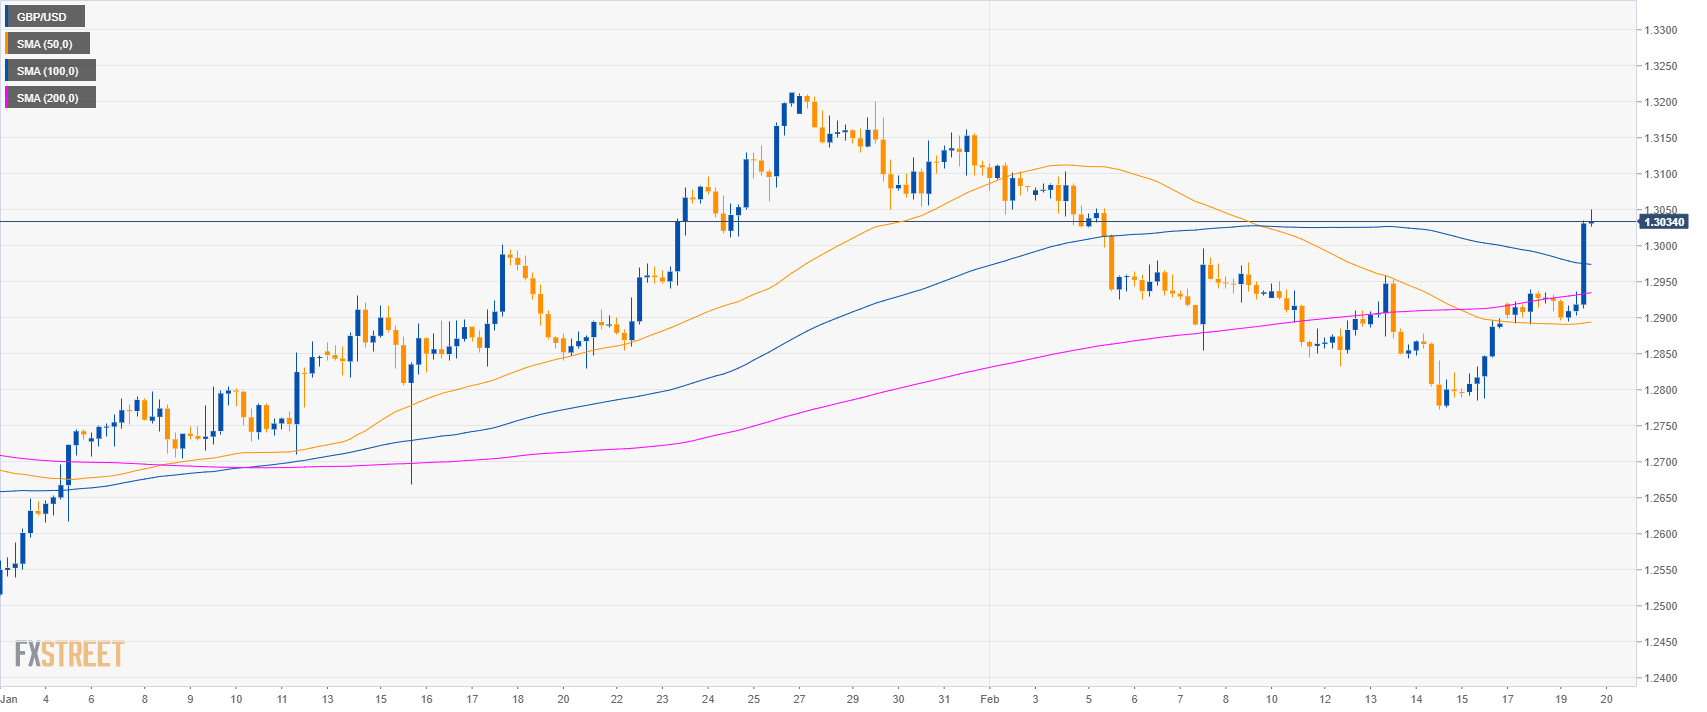
GBP/USD 4-hour chart
- GBP/USD bulls broke above the main SMAs suggesting a bullish bias in the medium-term.
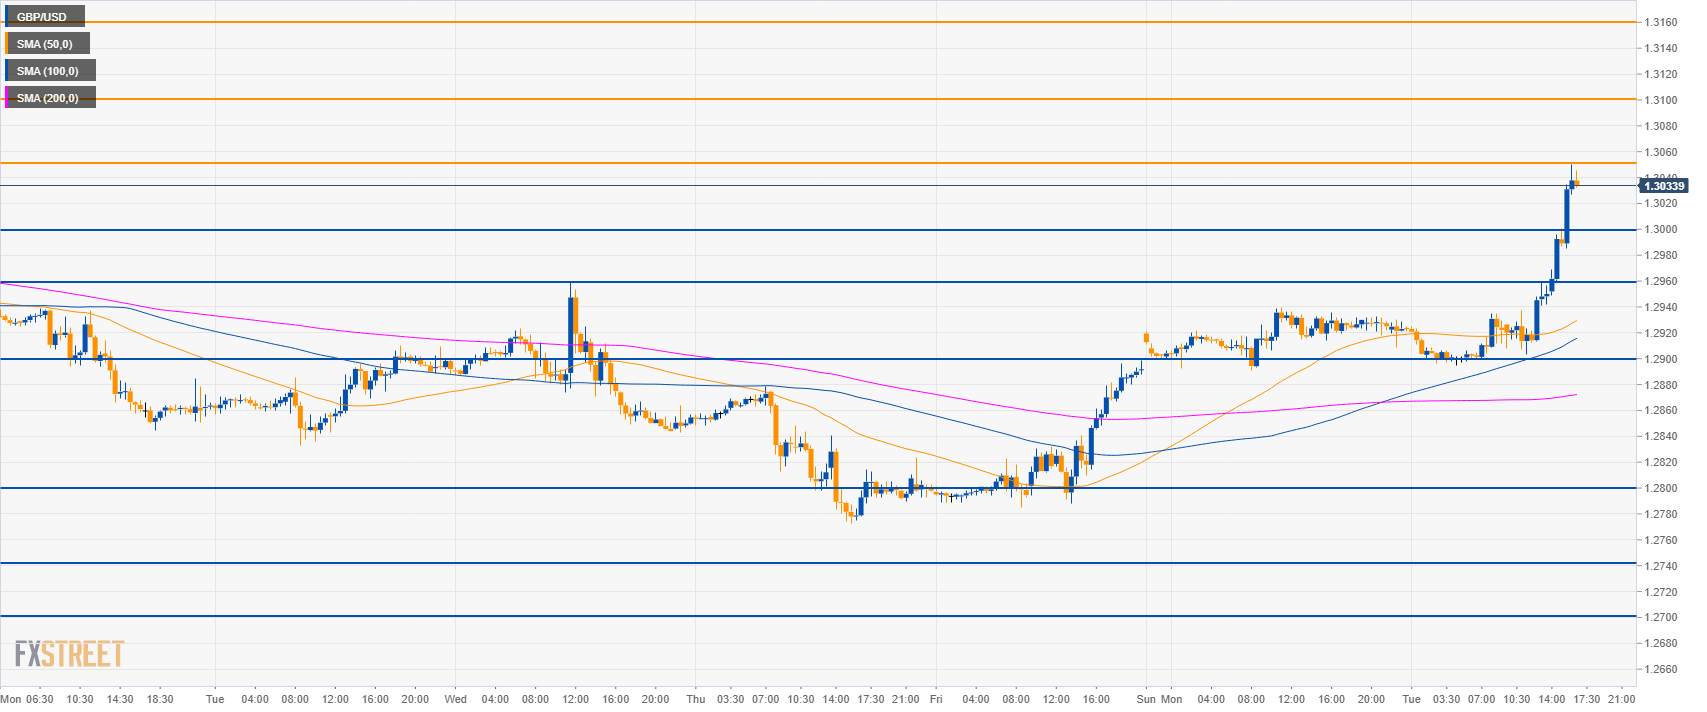
GBP/USD 30-minute chart
- GBP/USD is trading above the main SMAs suggesting a bullish momentum in the short-term.
- The level to beat for bulls is 1.3050. The next target to the upside is seen at 1.3100 figure.
- Support is at 1.300 and 1.2960 level.
Additional key levels
GBP/USD
Overview:
Today Last Price: 1.3036
Today Daily change: 108 pips
Today Daily change %: 0.84%
Today Daily Open: 1.2928
Trends:
Daily SMA20: 1.2993
Daily SMA50: 1.2831
Daily SMA100: 1.2877
Daily SMA200: 1.3004
Levels:
Previous Daily High: 1.294
Previous Daily Low: 1.2891
Previous Weekly High: 1.2959
Previous Weekly Low: 1.2773
Previous Monthly High: 1.3214
Previous Monthly Low: 1.2438
Daily Fibonacci 38.2%: 1.2921
Daily Fibonacci 61.8%: 1.291
Daily Pivot Point S1: 1.29
Daily Pivot Point S2: 1.2871
Daily Pivot Point S3: 1.2851
Daily Pivot Point R1: 1.2948
Daily Pivot Point R2: 1.2968
Daily Pivot Point R3: 1.2997