GBP/USD Technical Analysis: Cable trading below 1.3200 figure ahead of UK parliamentary debate on Brexit Plan B
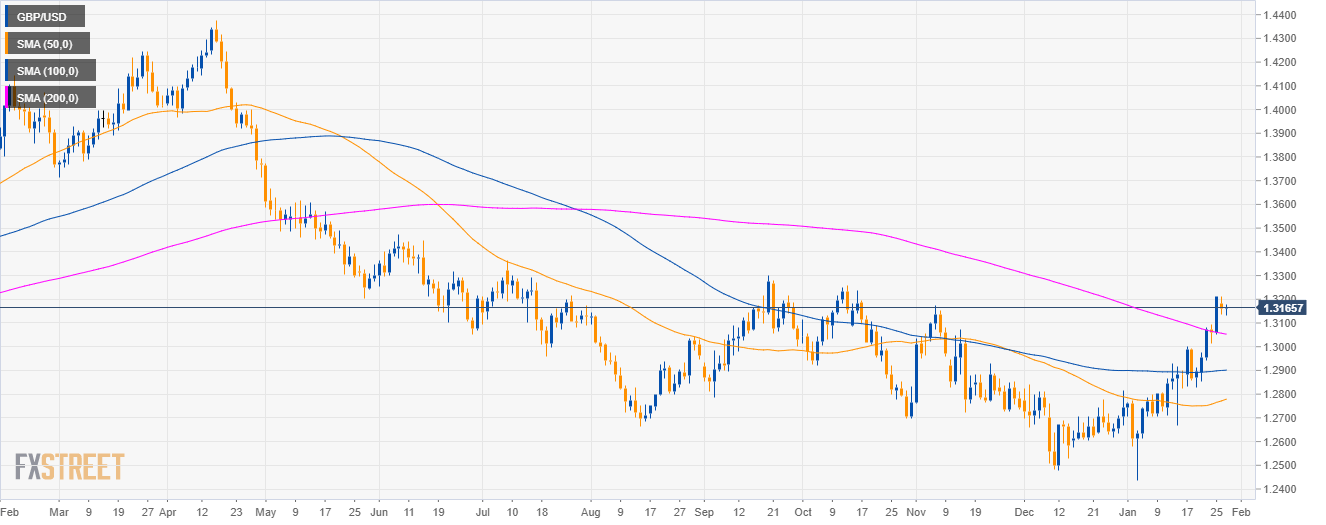
GBP/USD daily chart
- GBP/USD broke above the 1.13100 figure and the 200-day simple moving average suggesting bullish momentum on the daily time-frame.
- The Brexit Plan B amendments are going to be debated and voted in the House of Commons at around 19.00 GMT or later this week.
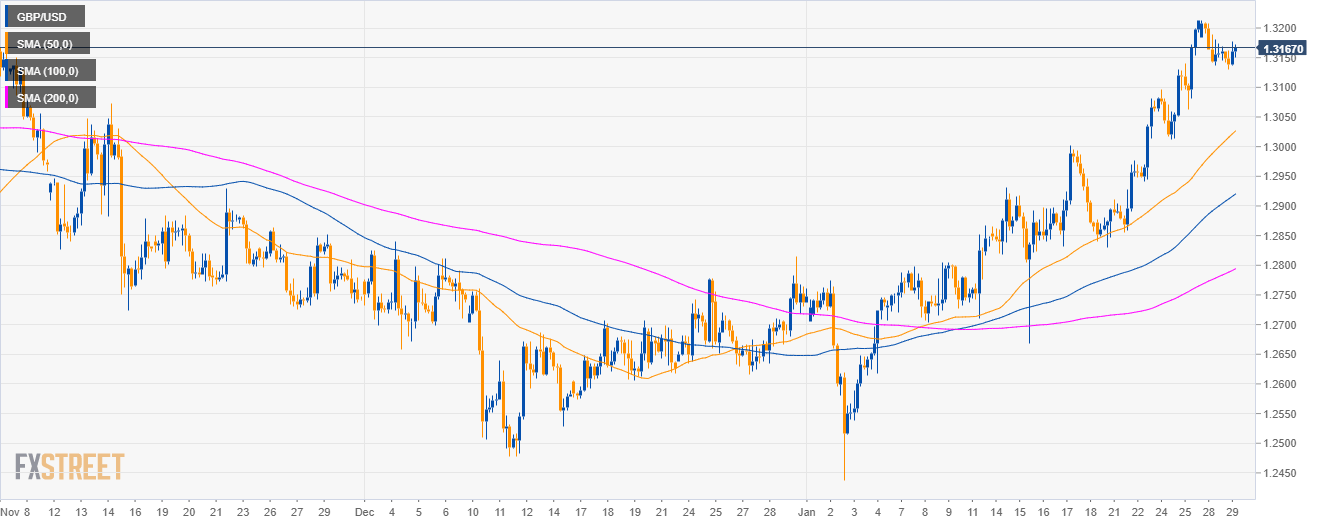
GBP/USD 4-hour chart
- GBP/USD is above its main SMAs suggesting a bullish bias in the medium-term.
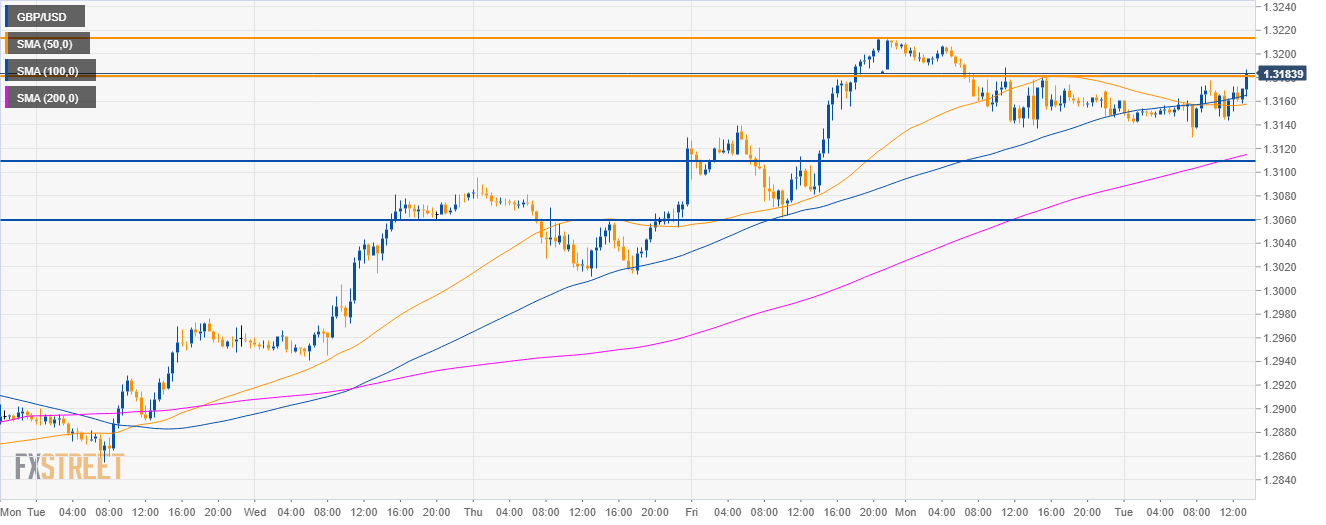
GBP/USD 30-minute chart
- Sterling broke below the 50 SMA and the 1.3200 figure against USD, suggesting a potential slowdown in the current bull trend.
- Targets to the downside can be seen near the 1.3100 and 1.3050 level.
- The 1.3180 and 1.3210 levels are resistances on Tuesday.
Additional key levels
GBP/USD
Overview:
Today Last Price: 1.317
Today Daily change: 7 pips
Today Daily change %: 0.05%
Today Daily Open: 1.3163
Trends:
Daily SMA20: 1.2873
Daily SMA50: 1.2771
Daily SMA100: 1.2899
Daily SMA200: 1.3058
Levels:
Previous Daily High: 1.3212
Previous Daily Low: 1.3137
Previous Weekly High: 1.3214
Previous Weekly Low: 1.283
Previous Monthly High: 1.284
Previous Monthly Low: 1.2477
Daily Fibonacci 38.2%: 1.3166
Daily Fibonacci 61.8%: 1.3183
Daily Pivot Point S1: 1.3129
Daily Pivot Point S2: 1.3096
Daily Pivot Point S3: 1.3054
Daily Pivot Point R1: 1.3204
Daily Pivot Point R2: 1.3246
Daily Pivot Point R3: 1.3279