Back
23 Oct 2018
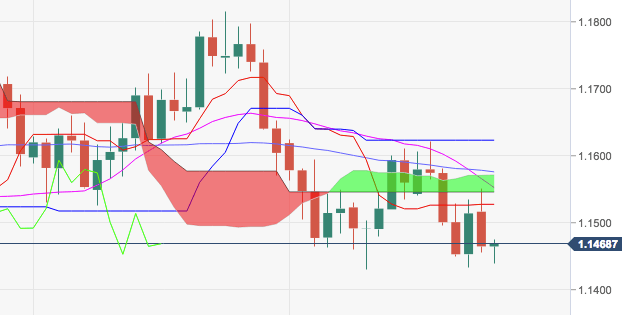
EUR/USD Technical Analysis: The pair remains capped by the lower 1.1600s
- Spot remains under pressure and navigates the lower end of the recent range and close to October’s low at 1.1432.
- Further south lies the critical 200-week SMA at 1.1319, considered the last defense of a visit to so far 2018 lows just below 1.1300 the figure.
- On the upside, recent tops in the 1.1620 area continues to cap the upside. Interim hurdle emerges at the 21-day SMA and the 55-day SMA at 1.1553 and 1.1576, respectively.
EUR/USD daily chart
EUR/USD
Overview:
Last Price: 1.1466
Daily change: -65 pips
Daily change: -0.564%
Daily Open: 1.1531
Trends:
Daily SMA20: 1.1571
Daily SMA50: 1.1584
Daily SMA100: 1.1623
Daily SMA200: 1.1909
Levels:
Daily High: 1.154
Daily Low: 1.1531
Weekly High: 1.1622
Weekly Low: 1.1433
Monthly High: 1.1816
Monthly Low: 1.1526
Daily Fibonacci 38.2%: 1.1496
Daily Fibonacci 61.8%: 1.1472
Daily Pivot Point S1: 1.1453
Daily Pivot Point S2: 1.1392
Daily Pivot Point S3: 1.1351
Daily Pivot Point R1: 1.1555
Daily Pivot Point R2: 1.1596
Daily Pivot Point R3: 1.1657