NZD/USD Price Analysis: Mixed outlook as indicators signal potential shift
- Technical indicators suggest a gradual recovery of buying pressure, but resistance at the 20-day SMA may hinder further gains.
- Indeed, the buyers got rejected at the mentioned average which made the pair trim daily gains.
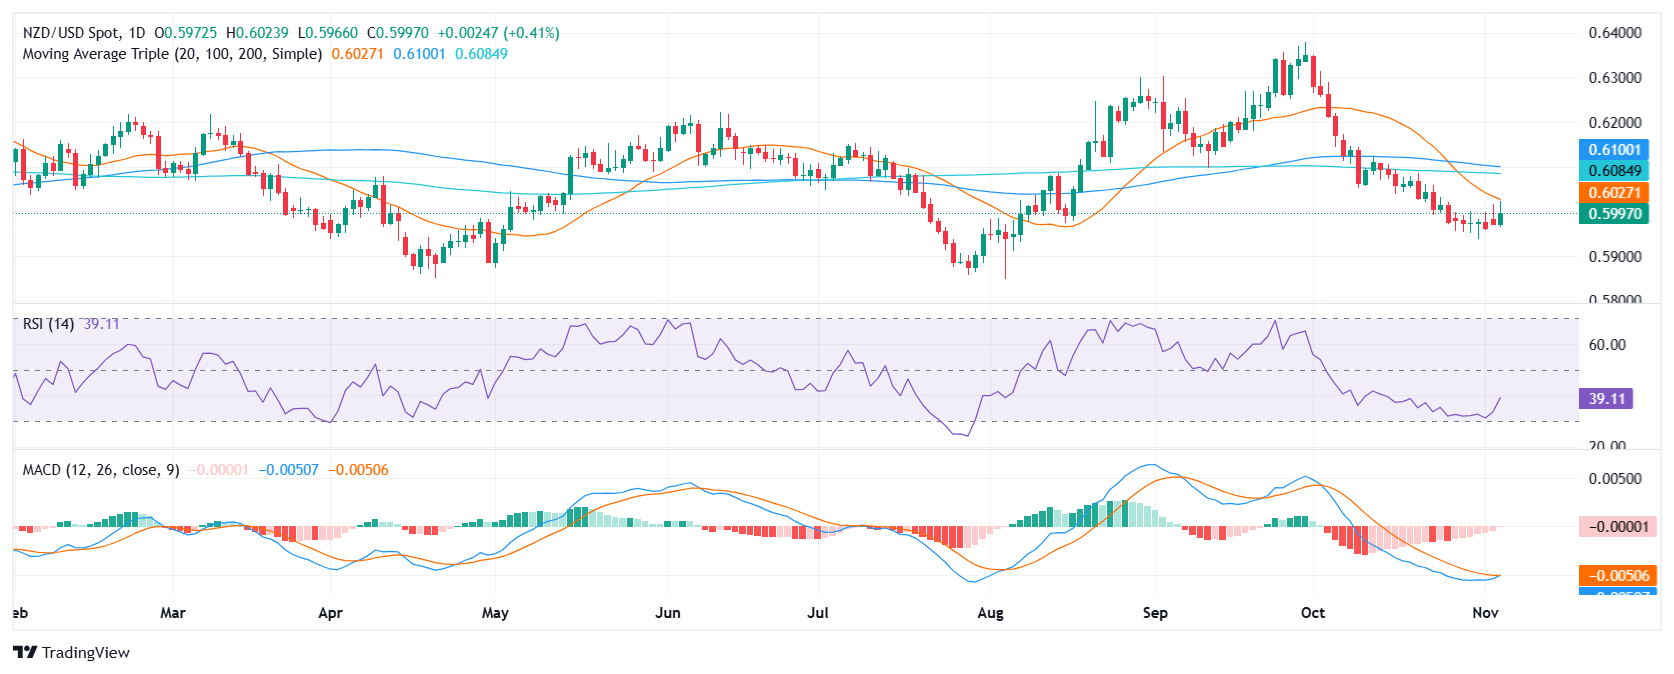
The NZD/USD pair has resumed its choppy movement, with a an upward bias, after a brief dip below the 0.6000 support. The pair is currently trading around 0.5994, facing resistance at the 20-period Simple Moving Average (SMA), which has capped further gains in recent sessions.
Technical indicators are recovering, suggesting a potential shift in momentum. The Relative Strength Index (RSI) is gradually recovering from oversold territory, indicating a recovery in buying pressure. However, the Moving Average Convergence Divergence (MACD) histogram remains negative, suggesting that selling pressure is still dominant.
If the RSI continues to rise and the MACD turns positive, it could indicate a shift towards a bullish trend. Conversely, if the RSI falls back into oversold territory and the MACD continues to decline, it could signal a continuation of the downtrend.
The pair is facing resistance at 0.6000, 0.6030, and 0.6040, while support is at 0.5960, 0.5930, and 0.5900.

