USD/JPY Price Analysis: Struggles at weekly highs, retraces back to 134.10s
- USD/JPY hit a weekly high of 134.46 but retraced toward the 134.10 area.
- USD/JPY Price Analysis: Negative divergence between oscillators and price action could pave the way for downside action.
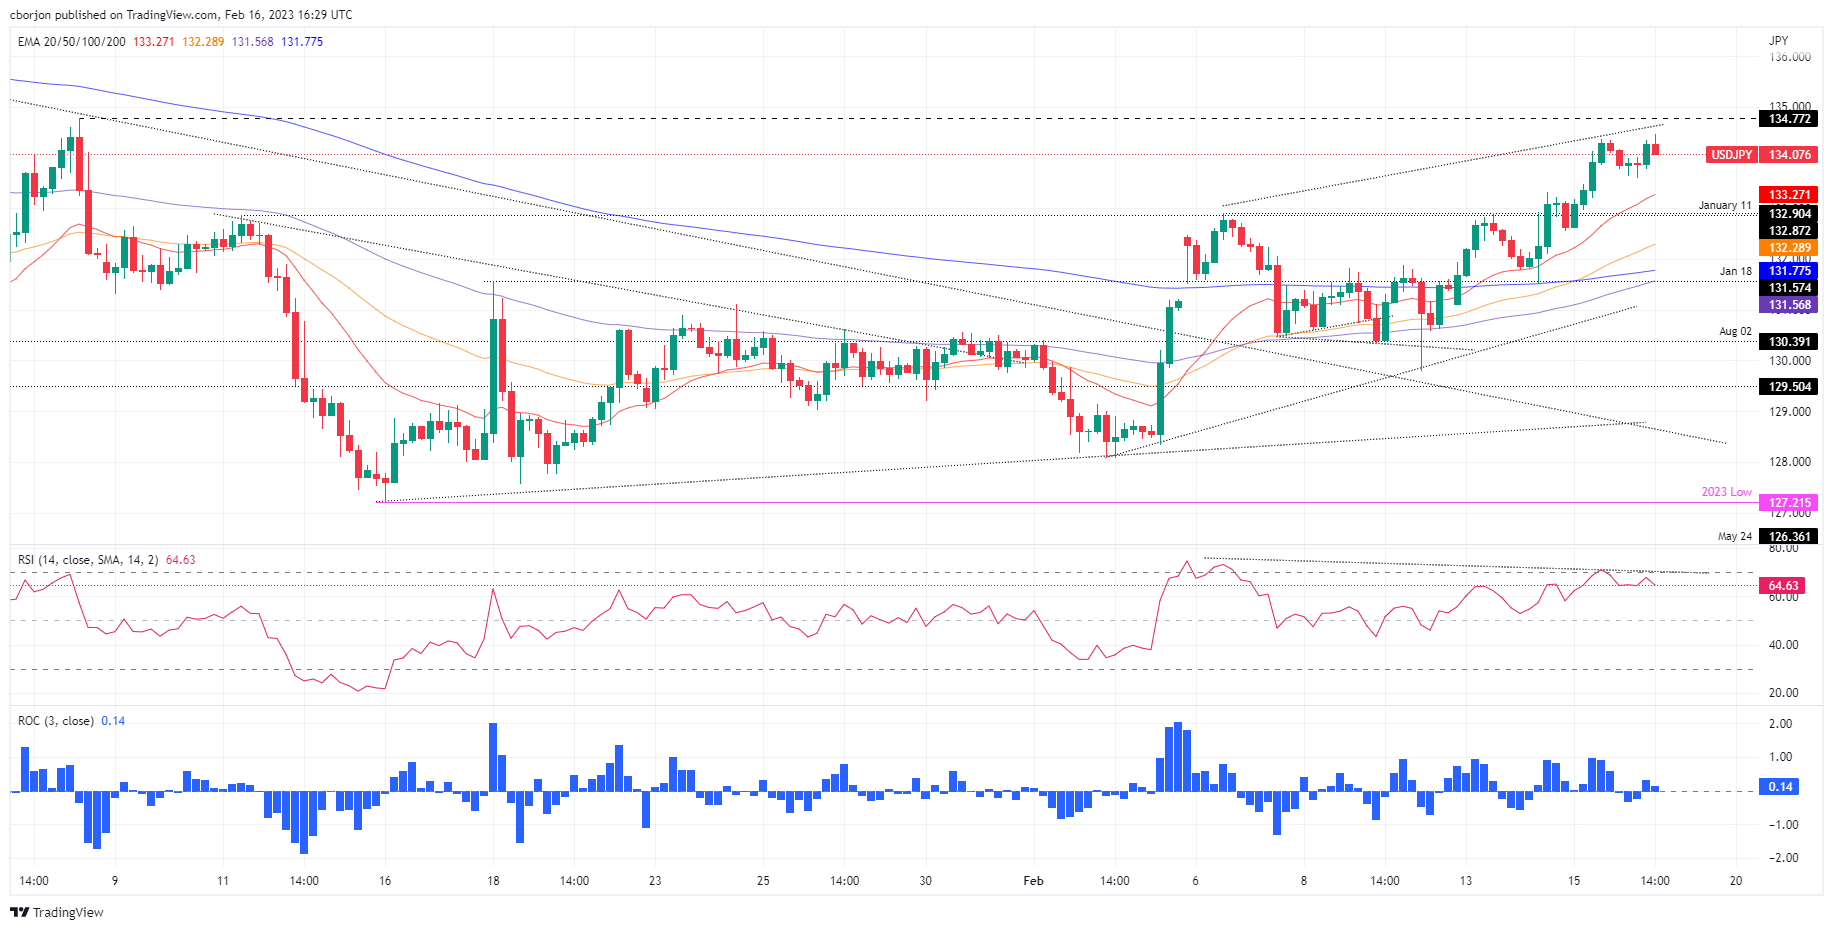
The USD/JPY consolidated around the 134.00 area after hitting a daily high of 134.46, though bears stepped in around the highs of the week, dragging prices lower. Hence, the USD/JPY changed its course gears and records minimal losses of 0.08%. The USD/JPY pair is trading around 134.10s on Thursday.
On February 15, the USD/JPY reached a daily high at 134.35, and since then, the USD/JPY has remained sideways within the 133.60/134.30 area. Even though the Relative Strength Index (RSI) is in bullish territory, as USD/JPY price action has headed north, the RSI did not. Hence, a negative divergence could emerge, suggesting that a price reversal looms.
If that scenario plays out, the USD/JPY first support would be this week’s low at 133.60. Break below, and the 20-day Exponential Moving Average (EMA) would be exposed at 133.28, followed by the February 13 daily high-turned support at 132.90.
On an alternate scenario, the USD/JPY’s first resistance would be the day’s high at 134.46, which, once cleared, could lift the USD/JPY to January 6 high at 134.77 before the major climbs to 135.00.
USD/JPY Daily chart

USD/JPY Key technical levels
